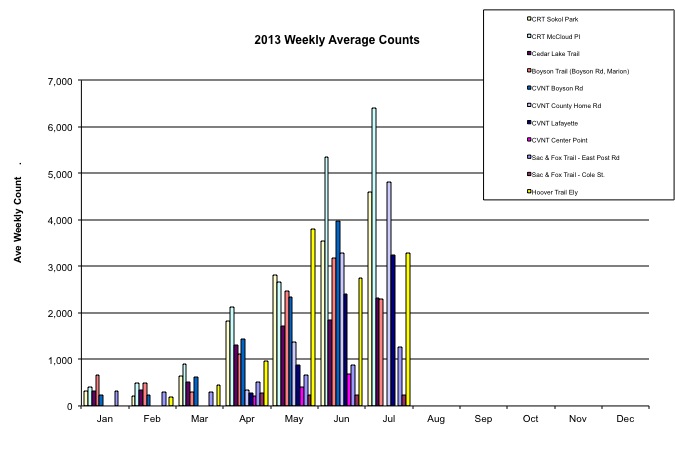
The following graph shows the average weekly counts for each month of 2013. It also shows the relative traffic on each of the trails since all trails are shown on the same graph.
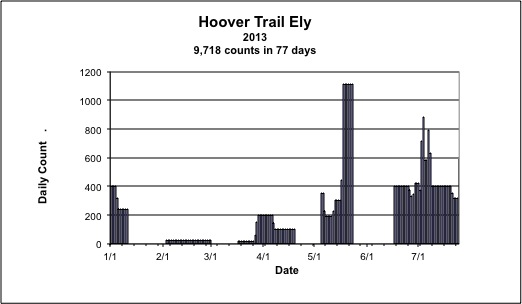
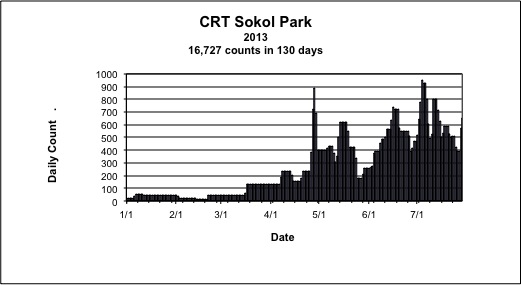
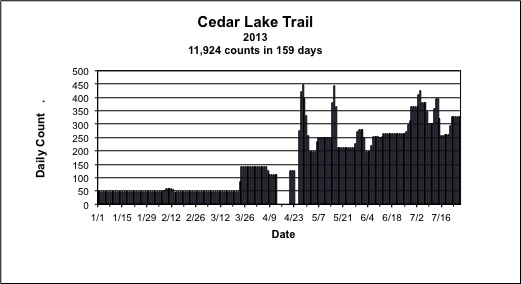
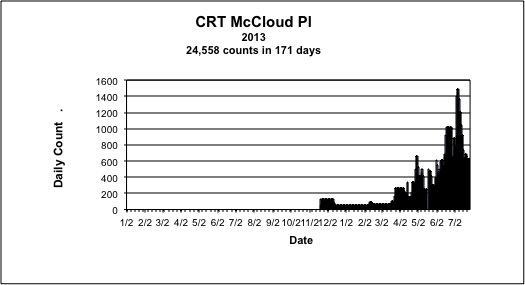
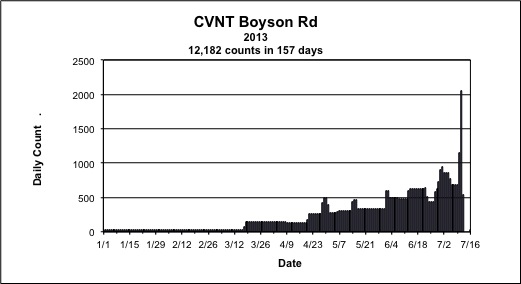
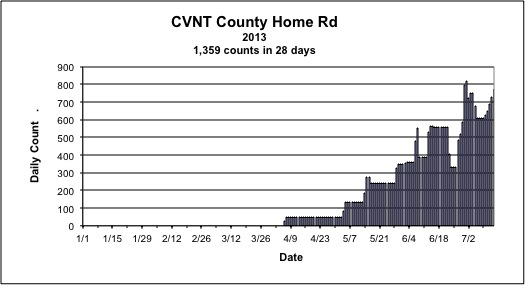
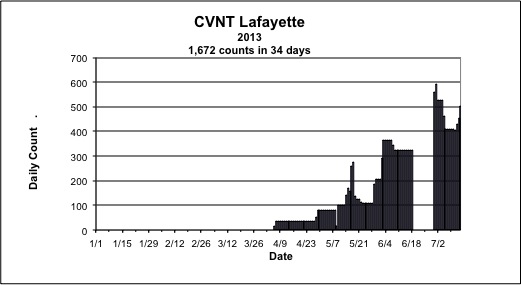
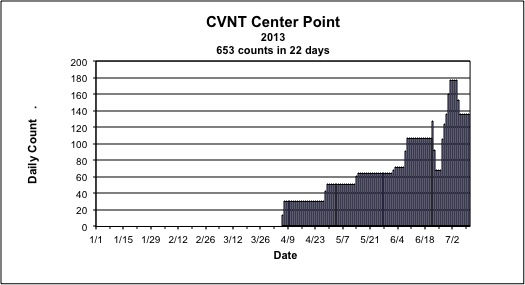
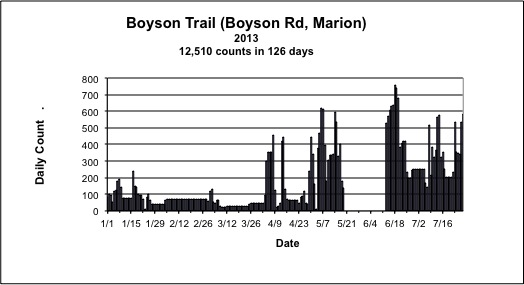
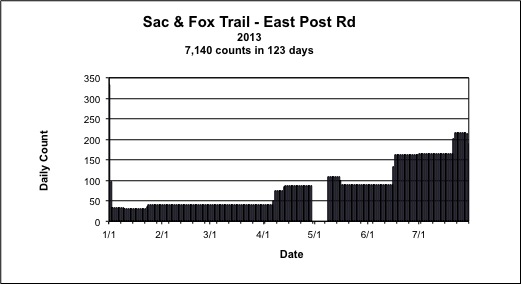
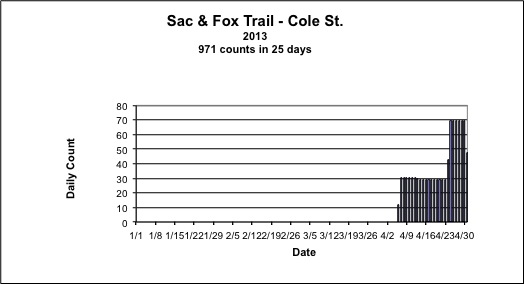
The graphs shown below are from data collected in 2013.
The following graph shows the average weekly counts for each month of 2013. It also shows the relative traffic on each of the trails since all trails are shown on the same graph.

The graphs shown below are from data collected in 2013.


